Insider's Game
Selected writings by David Fiderer
The Bush Tax Cuts and the Republican Cult of Affirmative Action
First published in The Huffington Post on November 14, 2010
“Poor me!” decried Warren Buffett. “I’m forced to pay more income taxes than everyone else in my zip code! Why should everyone else get a free ride?”
Because of his affirmative action mindset, which measures tax burden according to headcount instead of income, he was unable to evaluate fiscal matters in a mature, adult fashion. Of course the real Warren Buffet has none of the imbecility evidenced by right wing storefronts like The Heritage Foundation or The American Enterprise Institute, which promote the same claptrap about the superrich being victims of economic discrimination.
“The U.S. tax system is already highly progressive,” claims the Heritage Foundation, in text adjacent to a big chart filled with bright pretty colors. “The top 1 percent of income earners paid 40 percent of all federal income taxes in 2007, while the bottom 50 percent paid only 3 percent. More than one-third of U.S. earners paid no federal income tax at all.” Again, it’s all about taxes and headcount, with no mention of income, or income distribution, or fiscal prudence. These guys can’t walk and chew gum at the same time.
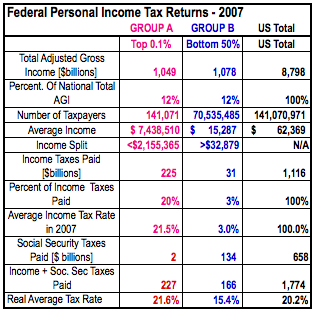
Two Groups of Taxpayers: Each Earned $1 Trillion
To explicate the many levels of deception embedded in these rightwing websites, we can look at some real numbers, and use real financial analysis. The starting point is adjustable gross income, not headcount, because, duh, income taxes are imposed on income. There are two groups that earned equivalent amounts of taxable income, just over a $1 trillion, each representing about 12% of the national total in 2007. We’ll call them Group A and Group B. Group A is the top 0.1% of earners (not the top 1%, the top 1/10 of 1%), all of whom earned in excess of $2.1 million that year.
Group B represents the bottom 50% of earners that year, all of whom earned less than $33,000. By definition, the headcount for Group B is 500 times larger than that for Group A. But don’t be fooled into thinking that most of 70 million Americans in Group B earned anything close to the princely sum of $33,000 in 2007. Their average income is less than half that amount. (If you find these numbers surprising, you obviously have not read Arianna’s latest book, Third World America.)
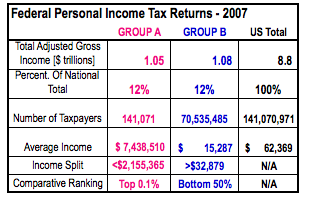
Source: IRS
Of course, the levels of taxable income seriously understate the disparity in wealth between these two groups. Many wealth transfers escape current taxation, because assets are passed through inheritance with a stepped up tax basis.
The rich pay all the taxes and other lies.
In terms of dollars and cents, Group A paid six times the total income taxes paid by Group B. “Aha!” say the right wing crackpots. “The rich pay all the taxes and everybody else gets a free ride.” Ariel Fleischer likened the situation to a pyramid scheme, something cooked up by Bernie Madoff. It’s a standard ploy of Fleischer and his ilk: Project your own dishonesty onto others.
Fraudsters like Madoff or Enron’s Jeffrey Skilling, or Ariel Fleischer all use the technique. They spew a lot of mumbo jumbo to conceal the truth about where the cash goes. Remember, in the real world, if you lose track of the cash, you are clueless. And in the real world, the notion that Group A pays out significantly more cash to the government than Group B is a great big lie. That’s because the cash paid out in Social Security taxes is used to subsidize the current operating deficit. This fact is indisputable.
Look at any the last 20 versions of The Budget and Economic Outlook published by the CBO, or look at historical tables from the OMB or any budget that has come out of the White House since the 1980s. They all say the same thing:
The “Off-Budget” results, aka Social Security, show surpluses. The “On-Budget” results, aka government operations, show deficits. The two are netted, so the On-Budget deficits don’t look so bad. The reason it was done this way was because, as noted before, here and here, the Bush Administration thought that Social Security benefits were a revocable promise. And of course Bush eagerly sought to formalize that revocation. Whether you agree or disagree with Bush, here are the facts:
In 2007, the On Budget Deficit was $642 billion.
In 2007, the Social Security Surplus was $183 billion.
In 2007, the Federal deficit was $459 billion.
Source: OMB Historical Tables, p. 23
The numbers are irrefutable and all cash is fungible.
So if you look at how all the cash is paid into the same budgetary pot, which is the only honest way to do it, then the truth emerges. Group A’s cash contribution of $227 billion is is not six times higher, but only 1.37 times higher than Group B’s cash contribution of $166 billion. And Group A’s tax rate was only 1.4% higher than the national average. (See note on calculations below.)
Again, we are not talking about fairness here, only financial transparency.
Real capitalists don’t coddle millionaire crybabies.
If you know something about business or finance, or if you are mature enough to live on a budget, you stay focused on the bottom line. You are always asking: How do I match up my cash revenues with my cash expenditures? There’s never one single answer, because in the real world nothing exists in a vacuum. To maximize revenues and minimize costs you evaluate how a combination of factors work together over the short term and the long term. In other words, if you are serious about fiscal discipline, nothing is off the table.
And if you hold a capitalist mindset you know that life is not fair. And while it’s nice to try to be fair and compassionate, performance is the thing that matters. Capitalists believe in rewarding success and punishing failure. As noted here before, we have ten years of performance data on the Bush tax cuts, and they failed by every possible criterion. And by every comparative measure, the tax policy under the Clinton Administration was a stunning success. Real capitalists like Warren Buffet believe we need to go back to what’s been tested and proven in order to determine how the government can boost revenues most efficiently.
Suppose we had returned to the proven success of the Clinton Administration, and applied 2001’s average national income tax rate of 14.23%, instead of the actual 2007 rate 12.68%. How would government revenues have been impacted? Revenues would have been boosted by about $136 billion, i.e. the deficit would have been reduced by $136 billion. Of course a real capitalist does not base his decisions on mere averages; he focuses on how to get the most bang for the buck. Think of it this way: If Tiffany’s wants to expand its business, it’s not going to open new stores in Appalachia; it will go where the money is.
So lets get back to Group A and Group B. Which group offers the most bang for the buck? On a percentage basis, the Bush tax cuts treated both groups about the same; both saw a percentage reduction of just over 30% in their income tax withholding. For Group A the average tax reduction was about $500,000; for Group B the average tax reduction was about $186, or 50 cents a day.
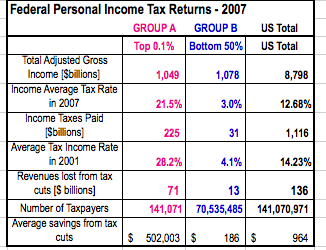
The real numbers illustrate one reason why, comparatively speaking, the rich are getting richer. Even for millionaires, $500,000 a year is a lot of money that they get to keep while the country’s finances fall into a sinkhole of debt. So when we consider how to deal with the federal deficit, which group offers more bang for the buck? The 141,000 taxpayers in Group A, for whom the Bush tax cuts increased the deficit by about $70 billion? Or the 70.5 million taxpayers Group B, for whom the Bush tax cuts increased the deficit by about $12 billion? To real capitalists, like Warren Buffet, the answer is obvious. And it’s time to stop coddling these affirmative action crybabies who say we need special protections for the rich because they pay more than their fair share.
And real capitalists have no patience for unregenerate liars like Mitch McConnell who say that tax cuts pay for themselves by stimulating economic growth. They never have and there’s no evidence that, under our current tax structure, they ever will.
* * *
Note on calculating Social Security Contributions: Here’s how the FICA tax contributions for Group A and Group B were calculated. The FICA tax rate is 12.4%, of which half is withheld from your paycheck and the other half is paid directly by your employer. In a free and competitive marketplace, the tax paid directly by your employer would otherwise be available to be paid out as direct compensation to you. That’s why it’s appropriate to view both halves as a financial burden on employees.
In 2007, the 12.4% social security tax was imposed on all wages up to $97,500, or a maximum of $12,090. So I assumed that each of the 141,071 taxpayers in Group A paid $12,090 in FICA taxes, or $1.7 billion collectively. I applied the 12.4% rate to all of the taxable income in Group B, resulting in a $134 billion tax contribution. Of course some of the members of Group A may not earn any wages and simply live of their investments, as opposed to the people in Group B, who have nothing left over to invest.