Insider's Game
Selected writings by David Fiderer
The Simple Arithmetic of the Mortgage Crisis Debunks Right Wing Media Narratives
First published in The Huffington Post on March 9, 2009
Five months ago, when the world trembled at the specter of a global financial meltdown, Rep. Darrell Issa of California ran on to Hardball to deliver a “f____-you” to his constituents. They live in San Diego and Riverside County, Ground Zero in the foreclosure crisis.
Explaining why he worked to defeat the bipartisan bailout deal intended to stabilize the mortgage markets, Issa, who had previously voted against laws to curtail predatory lending, blamed the Treasury Secretary. “You know, in fairness to Hank Paulson, I don’t know him well, but I know enough he’s not a banker, he’s comparatively a day trader,” said Issa. “We need him to get bankers to say how you stabilize long-term assets and stop treating it like it’s Goldman Sachs.” Issa’s poison darts foreshadowed the current rhetoric of Newt Gingrich, who rails against the “Bush-Obama continuity in economic policy.”
Why do fabulists like Issa can get traction in the media? One reason is that many talking heads still lack a command of the basic data. So much coverage of the financial crisis remains fragmentary, vague and anecdotal. For businessmen, the narrative is always framed by the numbers, the bottom line. There’s no way around it. If we want to grasp how we got in this mess we need to look at some numbers.
Here are the salient numbers, simplified in a user-friendly format, that get to the heart of the matter.
They explain the year-old diagnosis rendered by a Presidential Task Force headed by Hank Paulson:
“The turmoil in financial markets clearly was triggered by a dramatic weakening of underwriting standards for US subprime mortgages, beginning in late 2004 and extending into early 2007.”[Italics in original text.]
Why would subprime mortgages unravel the entire system? First of all…
Home mortgage debt is HUGE.
The residential mortgage market dwarfs the market for Treasuries. By the end of 2000, home mortgage debt in the United States was about $4.8 trillion, or about 1.4 times the Federal debt owed to the public. By the end of 2007, home mortgage debt had doubled, to $10.5 trillion, or 2.1 times the national debt. Since then, Federal debt has jumped up, to $5.8 trillion at September 30, 2008, whereas home mortgage debt has remained flat.
Home Mortgage Debt [$ trillions as of Dec. 31]
2000 $4.8
2003 $6.9
2007 $10.5
Source: Federal Reserve
Of course, this comparison understates the relative debt burden on homeowners, who, unlike the U.S. government, can neither roll over their debt indefinitely, nor print money.
Debt of the Federal Government [$ trillions as of Dec. 31]
2000 $3.4
2003 $4.6
2007 $5.1
9/30/08 $5.8
[The foregoing debt reflects amounts owed to the public. Most of the government debt racked up during the Bush years, excluded from the numbers above, was “borrowed” from the Social Security surplus.]
Home mortgage debt is central to the solvency of the financial system and, perhaps, to the U.S. government. Over eight years, the one category that grew as rapidly as home mortgages was the size of debt owed by financial entities. The two categories are related.
Debt Owed by Financial Entities [$ trillions as of Dec. 31]
2000 $7.4
2003 $10.9
2007 $16.2
Source: Federal Reserve
If you fear that some of that $10.5 trillion in home mortgage debt might be eventually converted into obligations of the U.S. government, you’re ahead of the game. Almost half of the domestic financial sector debt is already owed by Government Sponsored Entities, or GSEs – Fannie Mae, Freddie Mac, Ginnie Mae – either through mortgage securities that they guarantee, or through corporate bonds that have an implicit (perhaps soon to be explicit) government guarantee.
Debt Obligations of Government Sponsored Entities [$ trillions as of Dec. 31]
2000 $4.3
2003 $5.9
2007 $7.4
Another big factor in the debt markets is other asset-backed securities, which totaled about $4.5 trillion at the end of 2007. Of that amount, $2.1 trillion represents securities backed by home mortgages. These mortgage securities, known as private label securities, are fundamentally different from those underwritten by the GSEs, which imposed standardized quality controls over the entire mortgage lending process. Private label securities were neither standardized, nor were they subject to prudent credit controls, which is why they have incurred 60% of all mortgage defaults, and why they are difficult to value or trade.
Private-Label Residential Mortgage Securities [$ trillions as of Dec. 31]
2000 $0.5
2003 $0.6
2007 $2.1
Source: Federal Reserve
Of course, the Federal government also guarantees bank deposits (bank liabilities) which do not show up in the Federal Reserve numbers shown above. The safety of those deposits is also dependent on the recovery of mortgage loans directly or indirectly held by financial institutions. There’s a simple rule of thumb to remember about the banks’ ability to lend. For every dollar reduction in bank equity, a bank’s lending capability is reduced by at least ten dollars. So if banks lose a trillion dollars from defaulting mortgage loans, their ability to lend is reduced by $10 trillion.
Home mortgage debt increased with the real estate bubble. While the connection would seem obvious, it’s worth noting that the bubble was concentrated in some markets – especially in California and Florida – and not others. There was never much of a post-millennium bubble in Texas or Colorado, for instance. The Case-Schiller Housing Index is a user-friendly tool for tracking what happened over the past 20 years. It uses a January 2000 benchmark price of 100.00, further simplified here as 1.0.
With 1.0 as the January 2000 starting point, we can compare benchmark prices as of December 2003, before mortgage underwriting standards were weakened. Then we can see how, in the top 10 of the 20 markets listed below, the bubble inflated prices by June 2006.
Case-Schiller Housing Index
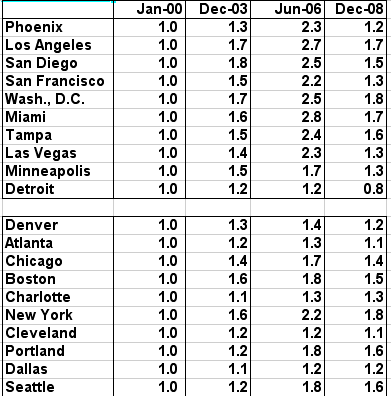
In just over 30 months, near the peak in the bubble around June 2006, home prices had risen in Miami and Phoenix by about 75%. By December 2008, index prices, the most recent available, had essentially returned to the same levels seen at year-end 2003.
If you’re someone like Rick Santelli, who lives in the Chicago area where the bubble was fairly contained, you may be inclined to think that the problem is limited to a small number of reckless individual borrowers. Those with a firmer grasp of the financial markets know otherwise.
The real estate bubble affects everyone. Most home purchases were made by people with good credit who took out standard prime loans after paying 20% down. The real estate bubble affects those people and the entire financial system, not just people who took out mortgages they could not afford. Using the Case-Schiller Index as a benchmark, anyone who took out a mortgage with 20% down during 2005 though 2007 in the top ten markets listed above now has negative-equity. His home is worth less than his mortgage. Distressed homeowners in those markets may ask the question, “Should I hand over the keys and walk away?”
And many people financed more than 80% of the appraised value. Many people, especially in California, financed up to 100% of their home’s purchase price with 2nd lien financing. Those subordinate loans probably have a value that’s close to zero. In late 2004 a different type of subordinate financing of residential mortgages took off, in the form of collateralized debt obligations, or CDOs. The current market value for a lot of those CDOs is also approaching zero.
Another form of 2nd lien financing was home equity lines of credit, which, as Alex Blumberg reported onThis American Life, some homeowners used “because people needed them to continue making their original mortgage payments.” [Every American should listen to “The Giant Pool of Money.”]
According to Economy.com, about 10% of homeowners have zero or negative equity.
The real estate bubble inflated where exotic mortgages were popular. At the height of the real estate bubble in the summer of 2006, the FDIC did a study which examined the impact of new exotic mortgage products, which began to take off in 2004. While the subprime mortgage business had been around for a while, innovative features – such as interest-only or negative amortization – only came into common use in late 2004.
Subprime Mortgages With
The following Features
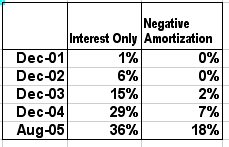
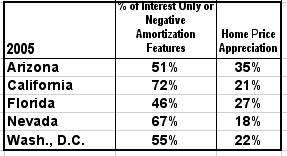
The FDIC study found a correlation between the popularity of interest-only or negative amortization features in non-prime mortgages and the price appreciation in local real estate markets.
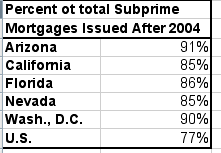
Subprime mortgages took off after 2004. Subprime mortgages had been around for a long time. But their popularity took off in late 2004. Most subprime mortgages were issued after 2004, according to a survey by the New York Federal Reserve.
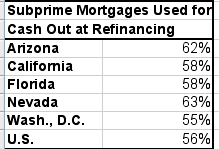
Subprime mortgages were not used primarily for new home purchases.
One of the familiar media narratives is that subprime loans were used as part of a government policy to make home ownership affordable to low-income people. But in fact most subprime loans were used to refinance existing mortgages, and not for new home purchases. And most of those refinancings were also used by home owners to take out more cash from their home equity. The cash-out may have been used to pay down credit card debt.
Many people who would have qualified for a traditional prime mortgage took out a subprime mortgage instead, based on the recommendation of mortgage brokers, who earned bigger upfront fees from the subprime product.
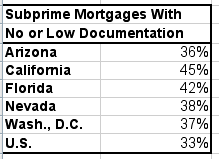
A big percentage of subprime mortgages had inadequate documentation. It’s easy to engage in mortgage fraud if you don’t need to prove your income or your net worth. And the proliferation of “no income, no asset” mortgage loans did just that. It was an invitation to fraud. This product was most popular in California and Florida.
Most subprime mortgages had adjustable rates. Most subprime mortgages had low introductory interest rates that reset after a few years. Often, when the rates were reset, homeowners discovered they were no longer able to afford the monthly payments.
Subprime Mortgages With
Adjustable Interest Rates
Arizona 73%
California 69%
Florida 65%
Nevada 68%
Wash., D.C. 68%
U.S. 61%
The foregoing numbers put Hank Paulson’s diagnosis in a proper context. They also debunk a variety of right-wing media narratives. Specifically, according to the numbers:
1. The mortgage problem has reached a magnitude that dwarfs the amounts of money spent elsewhere in the government sector. Dismissing the bailout as a “big government program” misses the point, given the amounts at stake in terms of global financial stability.
2. The mortgage problem extends far beyond subprime borrowers. Many prime borrowers now have negative equity in their homes.
3. The subprime problem reached a critical mass between 2003 and 2006, when the Republicans controlled the White House and Congress and did nothing. If you suggest that both parties are comparably deserving of blame, you are ignoring the salient data. [The well is also poisoned by the Swiftboating of prominent Democrats, such as Barney Frank and Chris Dodd, who fought hard to address the issue in the face of Republican footdragging.]
4. The rise in subprime lending from 2003 onward was not driven by government policies designed to make home ownership more affordable to low-income Americans or to stop redlining by banks. It was driven by innovative mortgage products, such as interest-only or negative amortization loans, and by the rise in the market for private label mortgage securities. Most subprime mortgages were not used for new home purchases.
The Bottom Line: Job 1 for every mortgage lender is the preservation of the value of the real estate collateral. Like it or not, this is now Job 1 for the federal government. In the context of what is at stake, Obama’s $275 billion plan for arresting the downward spiral of foreclosures seems fairly modest. But clearly, the job is too important and too pressing to be disrupted by cranks like Darrell Issa, who recently joined Barney Frank’s House Committee on Financial Services.