Insider's Game
Selected writings by David Fiderer
AIG’s Banks: Market Makers or Flippers of CDOs?
First published in The Huffington Post on February 3, 2010
[Update February 6, 2010 4:05 p.m.: An article in The New York Times confirms and amplifies information first reported here.]
Did Societe Generale ever view its $1.2 billion investment in Adirondack 2005-2 as a buy-and-hold proposition? Or was the bank’s original intention to offload the risk on to AIG? The answer is central to our understanding of the portfolio of collateralized debt obligations, or CDOs, that wiped out the insurance behemoth. The circumstances of SG’s, and other banks’ holdings, suggest that CDO market was a Potemkin’s Village, a facade constructed to give the illusion of economic substance to a series of sham transactions.
Adirondack 2005-2 is similar to Max CMBS I Ltd., Series 2008-1, and most of the other billion-dollar-plus exposures that stand out among the transaction details released last week. Whenever the dollar amount exceeds ten figures, the lion’s share of the entire CDO transaction is usually held by a single bank.
The biggest and most obvious example, disclosed last May, was Max 1. Deutsche Bank underwrote the $5.8 billion deal, and held on to $5.4 billion, a 94% share. This should have been a big story at the time. Max I was one of the largest CDOs ever underwritten, and the fact that Deutsche would have attempted to bring such a deal to market in June 2008, when everyone was feeling skittish about real estate securitizations, would have been notable in and of itself. Yet Deutsche was unable to sell off more than a tiny part of the deal. The fact that the underwriting failed should have been even bigger news. However no one paid much attention, since no public disclosure was required. Deutsche quietly offloaded its risk exposure to AIG Financial products.
The same holds true for Altius 2, a $1.5 billion CDO that Goldman underwrote in 2005. Goldman retained 75%, or a $1 billion share, which was covered by an AIG credit default swap. And then in the summer of 2006, Goldman underwrote West Coast Funding, a $2.7 billion deal, of which Goldman retained about $2.2 billion, or 82%. Though once again, Goldman’s risk amount got credit protection from AIG. [Note: The numbers are approximate, since each bank exposure, as of November 2008, is compared against the total deal size at closing. See further explanation at the end of this piece.]

By the standards of any normal bond underwriting, Goldman’s inability to sell down either Altius 2 or West Coast Funding would have been viewed as a conspicuous failure. And such news would have inhibited other banks and investors, including monoline insurers, from taking on incremental CDO exposures.
Had the subprime CDO market shut down in 2006, would there have been any ripple effect on other financial markets or the real economy? It’s doubtful, since the CDOs were not financing anything new. They merely repackaged versions of mortgage bonds that had already been sold into the marketplace.
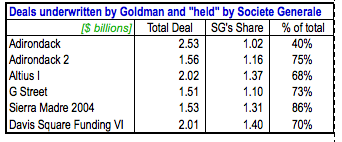
The AIG portfolio also reveals other examples wherein Goldman’s sell-down efforts met with apparent success. But that success was reliant on a single favored customer, Societe Generale. Goldman sold 75% ofAdirondack 2, 68% of Altius I, 73% of G Street, 86% of Sierra Madre 2004, and 70% of Davis Square Funding VI to SG.

These transactions are highly complex, with all sorts of pitfalls embedded in the documentation, which is one reason why it’s highly unusual for one bank to buy 70% of another bank’s structured finance deal. It’s even more unusual when the relevant amount approaches a billion dollars. Why would SG have taken on a risk concentration of such magnitude, unless it knew at the onset that the risk would be neutralized by AIG?
According to an internal AIG memo from November 2007, SG never took a proactive role in monitoring the market values of these CDO investments. The bank relegated that job to Goldman. It’s one thing to outsource that role when you hold a small slice of another bank’s deal. It’s quite another thing when you hold the dominant controlling share. You would think SG would have a keen interest in determining the amount of cash margin it would receive from AIG to cover the CDOs’ purported decline in value. The AIG memo states:
Sogen do not calculate prices themselves and simply ask the dealer they bought the bond from [i.e. Goldman] for a current estimate of the current levels [of estimated market values] and they then pass this level on to us…
At the time, SG asserted that the market value of its holdings in those six CDOs was between 64% and 87% of par. Of course, the entire notion of marking to market these CDOs was a bit of a fiction, as noted in anearlier piece about Goldman’s relationship with AIG.
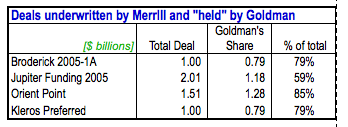
Goldman did the same thing as SG. It bought a couple of billion-plus slices, representing the dominant ownership shares, of another bank’s CDOs. Goldman’s seller of choice was Merrill Lynch. And of course, the risk for those investments was covered by credit default swaps sold by AIG.

That’s why you have to wonder if these transactions were put together as package deals – to give the illusion that the banks’ CDO activity was a reflection of legitimate market demand, and not an elaborate scheme of three-card monte.
Explainer on amounts and percentages: Most of the CDOs, and the banks’ nominal CDO investments, had amortized subsequent their initial closings. There has been no public disclosure, so far, of the size of the partially amortized CDOs as of November 2008, when the banks sold their CDOs to the government at par. Nor has there been any disclosure of the CDO amounts acquired by the banks before any amortization. The comparison between a bank’s individual slice and the overall deal size is, admittedly, an apples-and-orange comparison. But the flaw in this approach does not undercut the thesis, which is about order of magnitude. This approach understates the extent to which these individual banks held large and dominant shares of individual CDOs.