Insider's Game
Selected writings by David Fiderer
Homeownership’s Rise And Fall Is Disconnected From Conservative Mythology
First published in Medium on November 1, 2015
Critics of affordable housing policy draw upon a small inventory of metrics — factoids devoid of context — to “prove” their unsupportable arguments.
Take for instance, homeownership rates, which are driven by broad demographic trends. Very Serious People make the claim, based on no evidence other than social stereotyping, that the rise in homeownership was driven by government policy to finance mortgages for less-than-creditworthy borrowers. “From 1994 to 2006 U.S. homeownership rose from 64% to 69%,” writes Henry Paulson, to explain why, “government policies combined to over-stimulate homeownership with disastrous effects on the economy.”
Charles Lane go on to argue the decline in the homeownership rate “proves”that affordable housing policy was a failure in his Washington Post column. Lane derides Bill Clinton’s “national homeownership strategy,” which, in June 1995, set a goal of 67.5 percent homeownership by 2000. Successor George W. Bush promoted an “ownership society” with a target of 5.5 million new minority homeowners by 2010.
“Given the financial corners that were cut to pump up the rate, it’s also no surprise that the figure has retraced its statistical steps since the housing market began to tank in 2007,” writes Lane, who notes that the current homeownership rate is 64%. “Whether you blame Wall Street, Washington or some combination of the two, the simple fact is that government and business sold millions of people an American Dream that could not survive a sour economy, with nightmarish results for them and for the country.”
What evidence does Lane have to show that “financial corners that were cut to pump up the [homeownership] rate,”? None, other than his class bigotry.
Edward Pinto of the American Enterprise Institute (of “27 million subprime mortgages” fame) goes even further in U.S. News & World Report. “Today’s homeownership rate of 63 percent is no higher than it was 50 years ago,” writes Pinto. Why? Because of 30-year fixed-tate mortgages and affordable housing goals.
Lane and Pinto should go to the internet and lookup the phrase, “Correlation is not causation.” Then they need to spend a few minutes on census.com to disabuse themselves of cognitive flights of fancy.
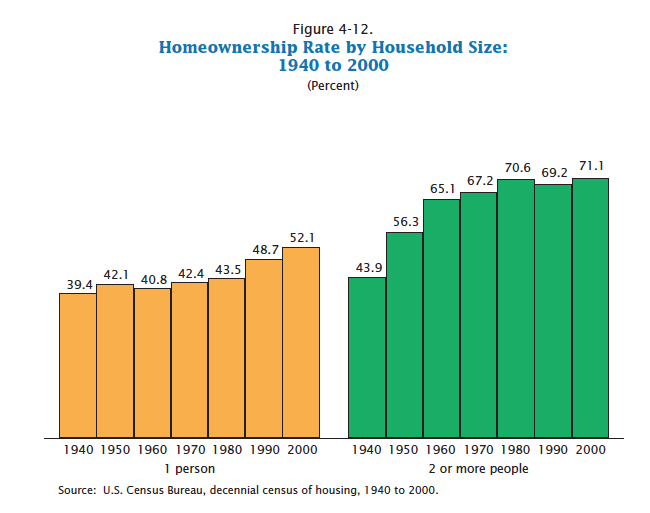
One picture from a Census publication, below, goes a long way toward illustrating why the causal relationships presumed by Lane and Pinto are more imaginary than real. The biggest demographic trend boosting homeownership, which gained steam in the 1980s and accelerated during the 1990s and beyond, had nothing to do with affordable housing goals. More and more people who were living alone decided to buy instead of rent. In 1980 43.5% of one-person householders owned their home. By 2000, 52.1% were one-person households were homeowners. By 2004 the live-alone homeownserhip percentage was 56%.
Whereas the homeownership rate among two-plus-person households barely budged over the span of two decades, from 70.6% in 1980 to 71.1% in 2000. Homeownership among two-plus-person households had slumped during the 1980s, when mortgage rates were in the double-digits, and when two serious housing downturns — in the oil patch in the mid-1980s, and in California plus the northeast beginning in the late 1980s — dampened demand.
There’s another factor that’s hard to overemphasize. During most of the 1990s, real median income rose sharply. Since 2000, real median income has fallen or stagnated.
Still, in the early 2000s homeownership did continue to rise, from 67.5% at the end of 2000, and peak at 69% in 2004.
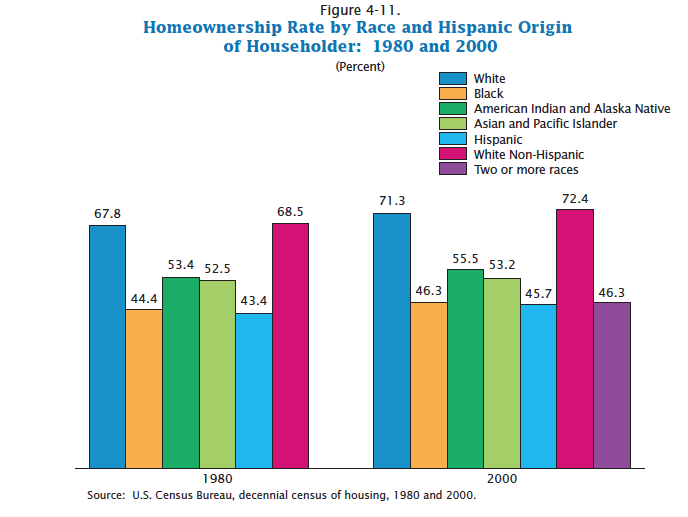
Contrary to what some dubious “mortgage experts” like to insinuate; housing policy didn’t do all that much for minority homeownership, as shown by the Census graphic below.
During 1980–2000, the biggest rise in homeownership, from 68.5% to 72.4%, occurred among non-Hispanic Whites. And the smallest rise occurred among Asians and Hispanics.
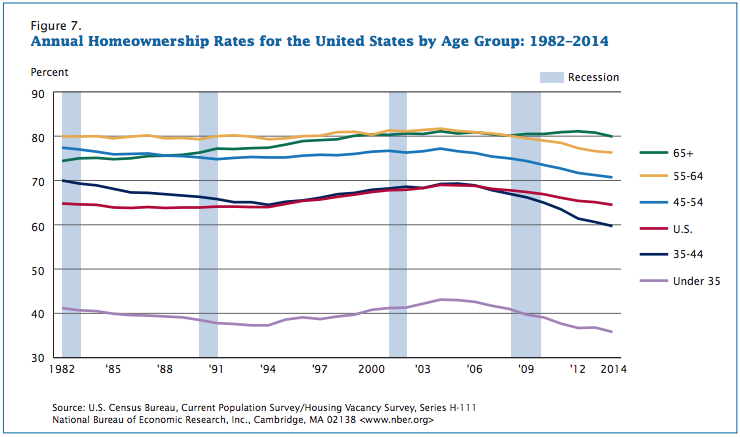
Since the peak of the bubble, home ownership has slumped, except among seniors. As the chart below illustrates, the younger the age cohort, the bigger the decline in homeownership. In 1982 70% of Americans aged 35–44 owned their homes; by 2014 the percentage was 60%.
This makes sense for several reasons. People who bought houses more recently, in the 21st century, were more likely to see their home equity wiped out. Moreover, the Great Recession hit younger people the hardest.
Finally — and this point cannot be over emphasized — younger people are burdened with debt, specifically college loans, which did not place such a heavy burden on earlier generations. Since 2000, the cost of tuition and fees at a public four-year college, in 2014 dollars, has almost doubled.
A study of Millennials by Deloitte University Press refers to, “the explosion in student debt” as “defining characteristic of the generation.” The study says:
Before the recent explosion of student debt, young people with student loan debt were actually more likely to take on other types of debt. To lenders, student loan debt has traditionally signaled that an individual had a college degree that increased earning potential. This is why, until recently, 25-year-olds with student loan debt were also more likely to have auto and home debt than those without student loan debt. That trend has changed in recent years. Now, 25-year-olds with student loan debt are less likely than their student loan debt-free peers to have a mortgage or auto loan…
The combination of high unemployment, high student loan debt, and the bursting of the housing bubble caused homeownership rates to fall even more sharply since 2007 for those under 35 years of age than among the population as a whole.
This type of empirical data, pertaining live-alone homeowners and Millennials burdened by student loans, is not terribly useful to those who start out with an agenda to trash Bill Clinton’s affordable housing policy.


