Insider's Game
Selected writings by David Fiderer
The Simple Arithmetic of Federal Deficits, A Counterpoint to the New York Times Analysis
First published in The Huffington Post on June 12, 2009
“The Great Debt Scare is back,” writes Robert Reich in response to a New York Times analysis of how the government’s finances devolved into a “Sea of Red Ink.” The Times’ starting point is a Congressional Budget Office forecast, presented in January 2001, which showed a $3.5 trillion surplus accumulated over the 2001 – 2008 period.
Actually, both Reich and the Times seem to be pulling their punches. They might have offered more cogent analyses had they let the numbers do the talking. The numbers show how we’ve been kidding ourselves for a long time.
The $5.5 Trillion Shortfall
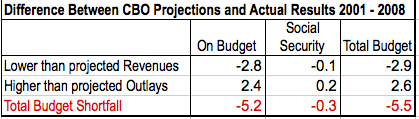
In January 2001 the CBO forecast that the government would accumulate, over the 2001 – 2008 period, a $3.5 trillion surplus. The actual results were about $5.5 trillion worse than expected; there was a $2 trillion deficit. Nonetheless, the CBO’s projections proved to be pretty accurate in one crucial area.
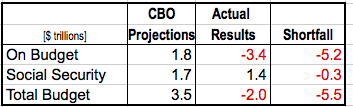
We forget that the original $3.5 trillion surplus was almost evenly split between the federal government, called on “On Budget” in CBO parlance, and Social Security, misleadingly labeled as “Off Budget” revenues and outlays. As it turned out, the government’s operating deficit was $3.4 trillion, or about $5.2 trillion worse than expected. But Social Security did in fact generate a $1.4 trillion surplus. In other words, about 95% of the $5.5 trillion shortfall is attributable to deficits created by the Federal government itself.
The $1.4 Trillion Social Security Subsidy, AKA “Unfunded Entitlements”
Of course, the Social Security surplus is a misnomer, in that it is already spoken for. It’s supposed to be the nest egg, comprised of standard Treasuries, held for the bulge of baby boomers who reach retirement age in about 10 years. But instead of issuing Treasury bonds, which effectively increases the money supply, the government uses that surplus to reduce the size of the government’s current operating deficit. Those never-purchased Treasury bonds are deemed to be “unfunded entitlements.”
[To recap the story those Social Security entitlements: They were funded by the employees and employers who paid in to the system. They could have funded the purchase of bona-fide Treasury bonds to pay for retirement benefits. They became unfunded when the government applied the proceeds to reduce its current operating deficits.]
Thanks to the $1.4 trillion Social Security surplus, the reported federal deficit was reduced by 40%, from $3.4 trillion to $2 trillion. The $2 trillion total doesn’t seem so bad when compared to that accumulated over prior eight-year-periods. The $1.7 trillion deficit for the eight years preceding the Clinton Administration seemed more onerous, since U.S. GDP at that time was much smaller.
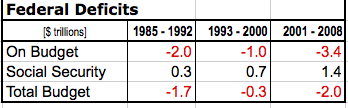
But notice how the Social Security surplus seems to double every eight years.
This was part of the grand design of Social Security. As we move closer to the day of reckoning for baby boom retirements, around 2016, when cash paid out by Social Security starts exceeding cash inflows, the annual surplus is supposed to grow steadily larger, thanks to the compound interest income earned by Social Security.
Bush Tax Cuts in An Historical Perspective
Was the $5.5 trillion shortfall caused by taxes or spending? As you might expect, it was a combination of both.
Most of the increased government outlays went to the myriad activities encompassed by the so-called global war on terror.
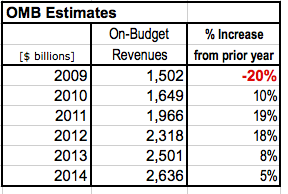
The decline in On-Budget revenues was unprecedented since the Great Depression. Historically federal revenues always rose because government spending always rose more.
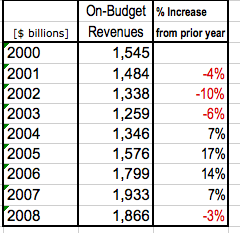
On rare occasions, federal revenues might decline in a single year, as they did in the 1983. But they never declined two years in a row, excepting the 1946-1947 period following World War II. In 2003, long after the last recession ended in November 2001, federal revenues were 19% below what they were in 2000. This should have been a signal to everyone that the current tax structure was unsustainable. But the growing impact of the Social Security surplus, which reduced the reported deficit, masked the underlying problems.
Revenues rose dramatically in 2005 and 2006, thanks to in large part to the taxable income derived from the real estate and financial bubbles.
Following the bubble came the meltdown, measured by a 20% decline in On-Budget revenues for 2009, according to estimates by the Office of Management and Budget. That’s a much bigger decline, on a percentage basis, than the decline after World War II.
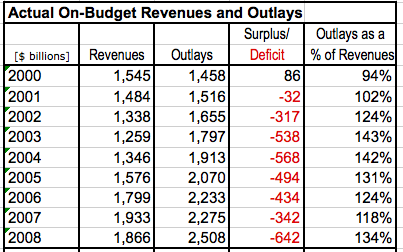
At the same time, the government in 2009 is spending a trillion dollars more than it spent in 2008. Look at how the situation progressed since 2001.
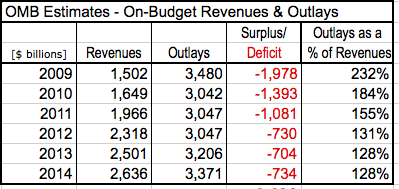
This is the situation that the Obama Administration inherited. The OMB projects that future deficits will dwarf all those prior to 2009.
Karl Rove emphasized that point. Since future deficits dwarf those experienced under Bush, Bush is blameless, he argues. As he told Greta Van Susteren the other night:
ROVE This guy is going to run up a $1.8 trillion deficit. That’s what it’s projected to be this year.
VAN SUSTEREN: Do you take some responsibility, meaning you, the Bush eight years, for this…ROVE: No.
VAN SUSTEREN: You take absolutely no responsibility? Because…
ROVE: No, let’s put…
VAN SUSTEREN: For the — for the debt.
ROVE: Well, look, we had a deficit that ran 2 percent of GDP. And we were fighting a war and trying to grow the economy. He’s planning a 4 percent of GDP.
VAN SUSTEREN: That’s twice.
ROVE: Twice. He’s going to — you know, his smallest deficit is $200 billion larger than Bush’s largest deficit. Think about that. Obama’s smallest deficit. We go to $1.8 trillion this year. We then decline under his budget plan to roughly $650 billion in three years. And then for the next seven years back — we go right back up to over a trillion-dollar deficit. That’s his plan, and that’s based on rosy economic assumptions. The deficit this year is expected to be $1.845 trillion.
As for the numbers, Rove is correct. As with Iraq and Afghanistan, George Bush left a situation that ties the hands of his successor.