Insider's Game
Selected writings by David Fiderer
Fatal Flaws In The Lawsuit Against Fannie Mae Execs, Part 2
First published in OpEdNews on December 27, 2011
The giveaway was what they didn’t say, or rather what was left out of the Non-Prosecution Agreement with the SEC. Usually, the deal includes a promise to “sin no more,” to stop making all those deceptive and misleading statements in its public filings. Not this time. Fannie Mae agreed to no such thing. Despite SEC claims that Fannie misled investors by underreporting the “true” exposure to subprime and Alt-A loans, despite unnamed sources claiming that the FBI is conducting a criminal investigation into the matter, Fannie has given no indication that it will change the way that it calculates its subprime or Alt-A numbers for bondholders and for the public. Nor has it suggested that it will amend any prior SEC filings. And the reason seems pretty obvious. The company wants to make sure that any financial disclosures continue to pass the laugh test.
Definitional Problems
As noted here before, as well as in Joe Nocera’s column in The New York Times, the SEC’s lawsuit against Fannie Mae executives depends entirely on the definitions of “subprime” and “Alt-A,” two terms for which there are no precise, generally agreed upon, definitions in the marketplace. The SEC claims that these executives had the specific intent to deceive investors about the quality of Fannie’s loan portfolio by deliberately understating Fannie’s exposure to “subprime” and “Alt-A” loans. As explained previously, SEC’s attempt to define “subprime” may not survive a motion to dismiss, because investors and judges read financial filings very carefully. They don’t cherrypick from the text . They read entire documents for context and interpret the meaning of “subprime,” accordingly.
The SEC’s definition of “Alt-A” is so broad as to be virtually meaningless. It designates as “Alt-A” any loan with “reduced documentation,” or “reduced and alternative documentation.” But those are terms could mean almost anything. “Reduced documentation” can refer to a loan for which the borrower proves his income with a W2 for last year in addition to a 1040 for the previous year. Or “reduced documentation” can refer to a “stated income/stated asset” loan, otherwise known as a liar loan.
Numbers Provide A Reality Check
The difficulty in defining these terms raises the obvious question: If everyone has a slightly different definition for a loan category, and the definitions have changed over time, how can anyone communicate? Why do people find these words to be meaningful? The answer is simple and obvious.
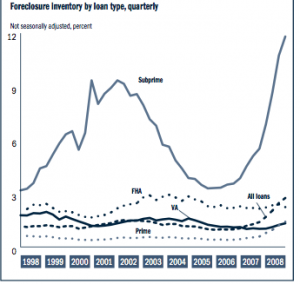
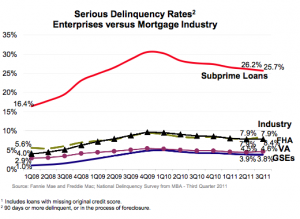
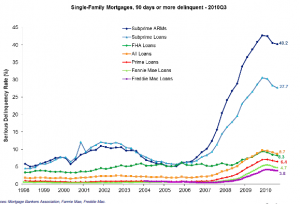
Everyone–aside from shills for right wing think tanks–uses a definition that can be validated by loan performance. The categorizations are supposed to identify those loans that will perform significantly worse than the rest of the mortgage market, or significantly worse than the rest of a loan portfolio. That’s the information investors seek out. For instance, the Mortgage Bankers Association shows a decade-long pattern wherein subprime loans, always a small percentage of the nationwide total, have serious delinquency rates several times higher than that of prime loans. In June 2008, the subprime segment represented about 12% of the overall mortgage market, but the subprime serious delinquency rate was six times that of prime loans.
The Federal Housing Finance Authority looks at it the same way; it compares subprime delinquency rates (using the MBA definition) with that of Fannie and Freddie. Invariably, subprime delinquencies are always six times higher.
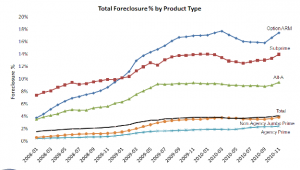
LPS, which uses a different definition of subprime and Alt-A, shows the same pattern. The subprime and Alt-A categories represent small percentages of the nationwide total, but their rates of foreclosure are many times higher than that for prime loans or for overall market.
Moody’s shows similar results in its July 15, 2011 report, “2005 — 2008 US RMBS Surveillance Methodology.” The ratings agency estimates that, for 2006-vintage private label securitizations, deals comprised of jumbo loans will lose, on average, 7.2% of the original loan balance. For subprime deals the loss rate is five times higher, or 37.6%. For Alt-A deals the loss rate is more than three times higher, at 25.3%. At the risk of belaboring the obvious, if you lumped together the jumbo loans and the Alt-A loans into one category, investors would get a misleading view of particular risk concentrations.
That’s why anyone who follows the mortgage markets would instantly recognize why Peter Wallison’s ridiculous claim–that 27 million loans, about half of all mortgages in the U.S., were “subprime or otherwise weak by 2008”–fails the laugh test. It’s like saying half of all college football players are likely to play for the NFL, or that half of all law students are likely to edit the law review. If 27 million loans are “subprime or otherwise weak,” how could it be that, following the worst housing crash in American history, no more than 8.1 million loanshave ever been delinquent, even for no more than 30 days? And why is it that, according to LPS, no more than 3.1 million loans, out of a nationwide total of 55 million, have ever been seriously delinquent?
Wallison’s colleague at The American Enterprise Institute, Ed Pinto, devised his own definition of “nonprime” to arrive at a 27 million number that would lend a veneer of plausibility to Wallison’s false claim that government housing policies and the GSEs, not Wall Street, were the primary causes of the financial crisis. But again, real investors examine loan performance on a comparative basis. That’s what the FCIC did when it eviscerated Pinto’s “research.” That’s what the Center for American Progress did when it similarly demolished Pinto’s work. That’s the issue Wallison publicly promised he would address in his FCIC dissent. But of course he never did. (Which may be why the AEI scrubbed the video of Wallison’s response to David Min’s withering analysis.) Instead, Wallison lied to Congress and claimed that that the FCIC never examined Pinto’s work. That’s why Washington Post columnist Barry Ritholtz identified Peter Wallison as one of the biggest proponents of The Big Lie about the financial crisis. And that’s why Joe Nocera, bound by the stylistic guidelines of The New York Times, characterized Wallison’s solitary FCIC dissent as “a lonely, looney cri de coeur.”
Everyone who seriously follows the mortgage markets knows that, for than a decade, GSE loan performance is exponentially superior to that of the rest of the market.
Which is why none of the other Republicans on the FCIC dared to attach their names to Wallison’s dissent. Wallison, Pinto and their supporters remain adamant in their steadfast refusal examine comparative loan performance data. But as Ritholtz notes, “[E]conomics looks at actual consequences in terms of real dollars. So let’s follow the money and see what the data reveal about the causes of the collapse.” Which is why Nocera chastised Republicans for parroting Wallison’s crackpot claims.
Which is why none of the other Republicans on the FCIC dared to attach their names to Wallison’s dissent. Wallison, Pinto and their supporters remain adamant in their steadfast refusal examine comparative loan performance data. But as Ritholtz notes, “[E]conomics looks at actual consequences in terms of real dollars. So let’s follow the money and see what the data reveal about the causes of the collapse.” Which is why Nocera chastised Republicans for parroting Wallison’s crackpot claims.
Fannie’s Loan Performance In Context
Nocera argues that the SEC complaint, like Wallison, invents new definitions so as to inflate the numbers of high risk categories. Wallison says that the complaint vindicates his thesisand discredits the FCIC report. Of course, the opposite is true. The complaint confirms the FCIC’s findings that Fannie increased its appetite for low-documentation loans beginning in 2005, in order to recover market share that was lost to private label securitizations, notpursuant to government housing goals.
However, no one disputes the total credit losses on Fannie’s $2.7 trillion single-family loan portfolio over the last few years. The only dispute is over how those loan losses should have been allocated. Viewed in that context, both the SEC complaint and Wallison’s thesis, simply fall apart.
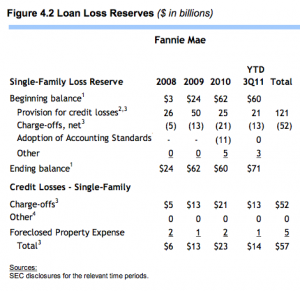
The FHFA lays most of it out on pages 12 and 13 of its latest Conservator’s Report on Fannie and Freddie. On page 12, you see that, over the past 3.75 years, Fannie’s cumulative credit losses (Provision for Credit Losses) total $121 billion, on a mortgage book that has remained pretty stable at around $2.7 trillion. So the cumulative loss rate is about 4.5% of the portfolio.
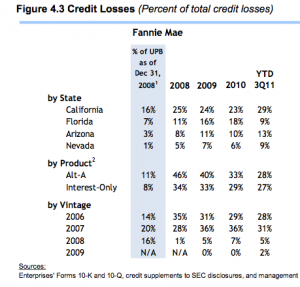
And if you look on page 13, you can see that Alt-A loans (as designated by Fannie), were about 11% of the mortgage book at year-end 2008. But they generated about 38% of cumulative credit losses. Based on the reported 12/31/08 Alt-A balance, $292 billion in loans had a loss rate of about 16%, or about five times higher than that for the remaining $2.4 trillion mortgages on Fannie’s books. For the other 89% of the loan book, the loss rate was under 3%, which is pretty damn good performance after a housing crash. (See also, “The Real Reason Fannie and Freddie Lost So Much Money.”)
And if you look on page 13, you can see that Alt-A loans (as designated by Fannie), were about 11% of the mortgage book at year-end 2008. But they generated about 38% of cumulative credit losses. Based on the reported 12/31/08 Alt-A balance, $292 billion in loans had a loss rate of about 16%, or about five times higher than that for the remaining $2.4 trillion mortgages on Fannie’s books. For the other 89% of the loan book, the loss rate was under 3%, which is pretty damn good performance after a housing crash. (See also, “The Real Reason Fannie and Freddie Lost So Much Money.”)
Remember, investors are looking for risk concentrations indicating poor loan performance. Based on Fannie’s reported Alt-A loan data, investors see a proportionality and order of magnitude that appears to be consistent with loan data reported everywhere else.
But consider this paragraph from the complaint:
165. On average throughout the Relevant Period [between December 6, 2006, and August 8, 2008], Lender-Selected Reduced Documentation Loans – the undisclosed Alt-A loans – had SDQ [i.e. serious delinquency] rates that were 1.4 times higher than full documentation loans with otherwise similar credit risks.
That appears to be a somewhat misleading way of saying that the serious delinquency rates on the “undisclosed Alt-A loans,” were not very different from the companywide average. The entire loan book’s serious delinquency rate, during the relevant period, was between 1.2 to 1.3 times higher than the serious delinquency rates of all loans exclusive of the disclosed Alt-A loans. Whereas the disclosed Alt-A loans had a serious delinquency rate that was 2.6 times to 3.6 times higher than the rest of Fannie’s loan book.
The SEC claims that the “true” Alt-A amounts were twice as high as the reported Alt-A amounts. For instance on march 31, 2008, Fannie reported $311 billion in Alt-A loans, and the SEC says that Fannie omitted approximately $323 billion from the total Alt-A amount. But since the “undisclosed” Alt-A loans had a serious delinquency rate that was about half that of the disclosed Alt-A loans, inclusion of those additional loans would have significantly improved the delinquency and default rates for that risk category.
Which is why the SEC will never be able to prove that that top management had the specific intent to deceive investors, who were also harmed by management’s Alt-A categorizations. And which may be why Nocera, bound by the Times penchant for understatement, characterized the case as “extraordinarily weak.”
